What is the “Event Logs” Windows forensic artifact?
Windows Event Logs are a standardized, system-wide logging mechanism that records significant hardware, software, and system-related events. They are designed to provide administrators and applications with a centralized way to report important information that may require attention. These logs are stored in a proprietary binary format (.evtx) and are typically found in the %SystemRoot%\System32\winevt\Logs\ directory. The most commonly analyzed logs include the Security, System, Application, and PowerShell logs, each capturing different categories of events from user authentication attempts to application crashes and system service status changes.
In a DFIR investigation, Event Logs are one of the most foundational sources of evidence. Each entry, or event record, contains a timestamp, an event ID that describes the action, the user or system account associated with the event, and often specific details like source IP addresses or filenames. Security logs are crucial for tracking user logons (successful and failed), account modifications, and privilege escalations, which can reveal unauthorized access or lateral movement by an attacker. System and Application logs can indicate the execution of malware, unexpected service terminations, or system reboots that help establish a timeline of an incident. Analyzing these logs allows an investigator to reconstruct a sequence of events, identify the initial vector of compromise, and trace an attacker’s activity across the system.
Enterprise Forensic Applications
Event Logs are the bedrock of timeline reconstruction. In the context of a Proactive Compromise Assessment, TensorGuard automates the parsing of thousands of .evtx files across an enterprise to flag anomalous account creations, RDP lateral movement, and unauthorized log-clearing attempts. This capability transforms weeks of manual SIEM query correlation into minutes of evidence-backed certainty, fundamentally shifting the economics of digital forensics.
Collecting, Decoding, and Viewing “Event Logs” with TensorGuard
- Create a TensorGuard account and sign in to the TensorGuard console at https://app.tensorguard.com.
- Select “Case Manager”, then the plus button to create a case. This will contain your enrolled devices, their reports, and any manually submitted collections.
- Linked inside the case menu, download the TensorGuard Forensic Collector and run it on your target system.
- In the console, click the plus button for “New Enrollment”, copy the enrollment key, and paste it into the TensorGuard Forensic Collector on your target device.
- Now that you have a device enrolled, select the device(s), and click “Send Signal”. Answer the questions regarding what you want to look for in the analysis, any alerting on positive findings, and if the collection and analysis should be recurring.
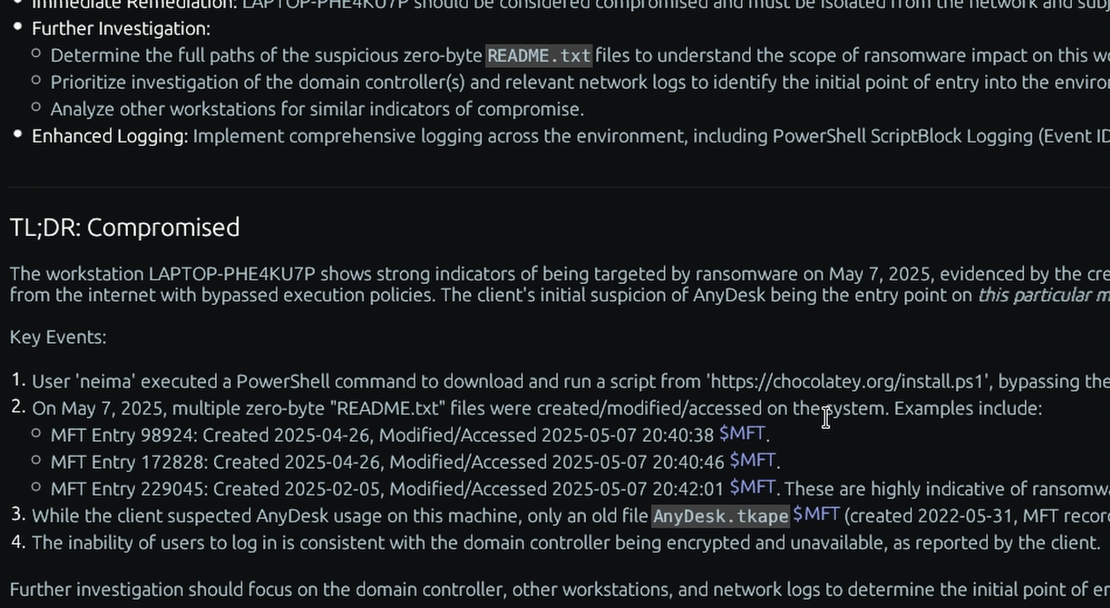
- Once the report is generated, you’ll have Event Logs delivered in the browser, alongside an executive summary and timeline of findings.
Get Started
TensorGuard™ is a trademark of TensorGuard Inc. All other trademarks are the property of their respective owners. The information provided on this blog is for educational and informational purposes only and does not constitute legal, forensic, or professional advice. Due to the complexities of Digital Forensics and potential legal implications, you should always consult with qualified legal counsel or a certified digital forensics expert before taking action based on findings.

Event Logs
Windows
The computer’s diary, recording important system, security, and application events as they happen.
About Event LogsStart with a Compromise Assessment.
The best way to see the power of TensorGuard is to use it. For a simple, flat fee, we will conduct a full, AI-powered Compromise Assessment on a selection of your critical systems.